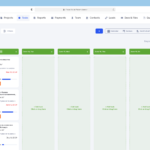
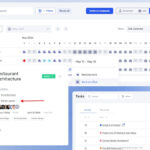
Planning just got easier. if.team now features a Gantt chart — a visual way to manage projects on a timeline. Edit dates, track progress, and stay in control with a single click.
What is a Gantt Chart?
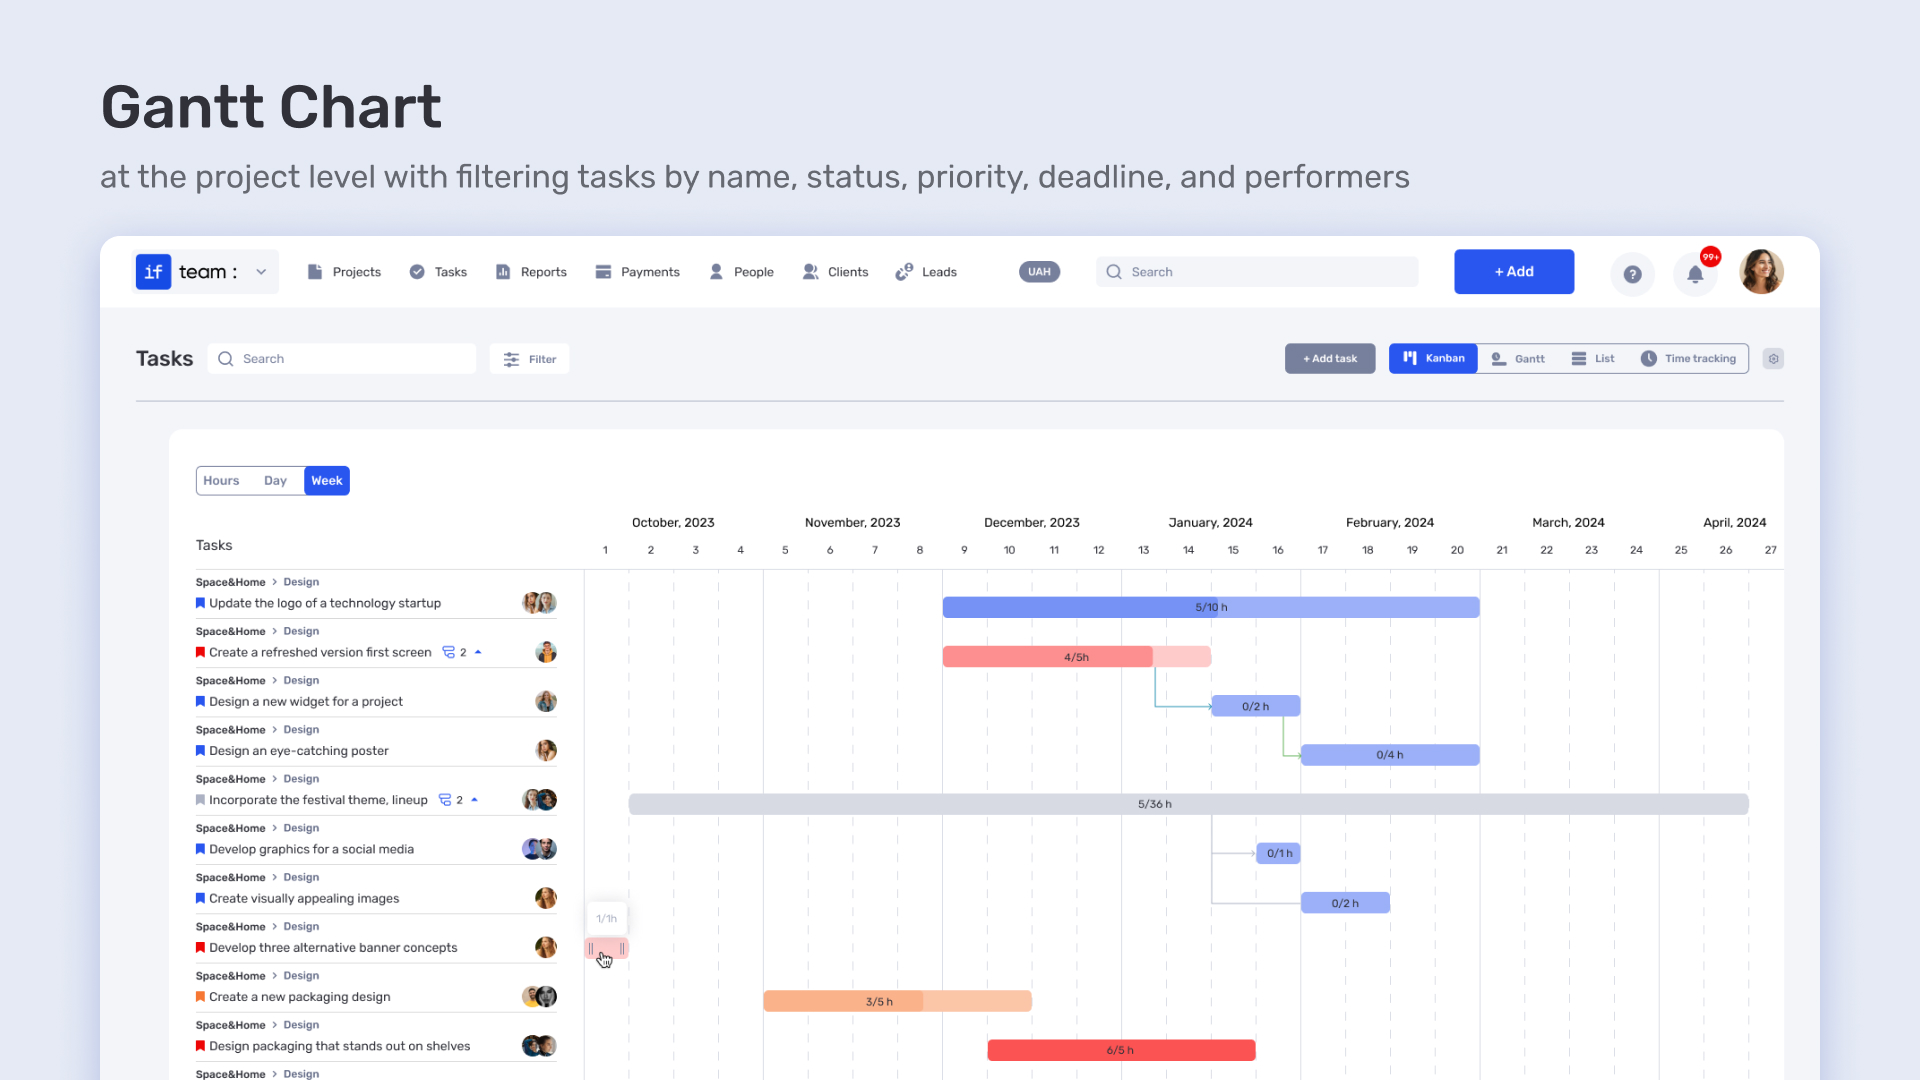
A Gantt chart is a simple yet powerful tool for visualizing project work. It displays tasks as horizontal bars along a timeline, showing when each task starts, how long it lasts, and when it ends.
Instead of digging through cluttered lists or spreadsheets, you get a clear, visual overview of what’s happening in the project, when it’s happening, and how long it will take. It makes understanding and planning much easier.
Why it matters:
You see all projects at a glance — like a map.
It helps spot scheduling overlaps, bottlenecks, or potential delays.
It’s easier to manage deadlines and allocate resources.
It improves communication — everyone sees the same picture.
In if.team, the Gantt chart is fully integrated. It works with your existing projects right out of the box — no setup or third-party tools needed.
New Gantt Chart features in if.team
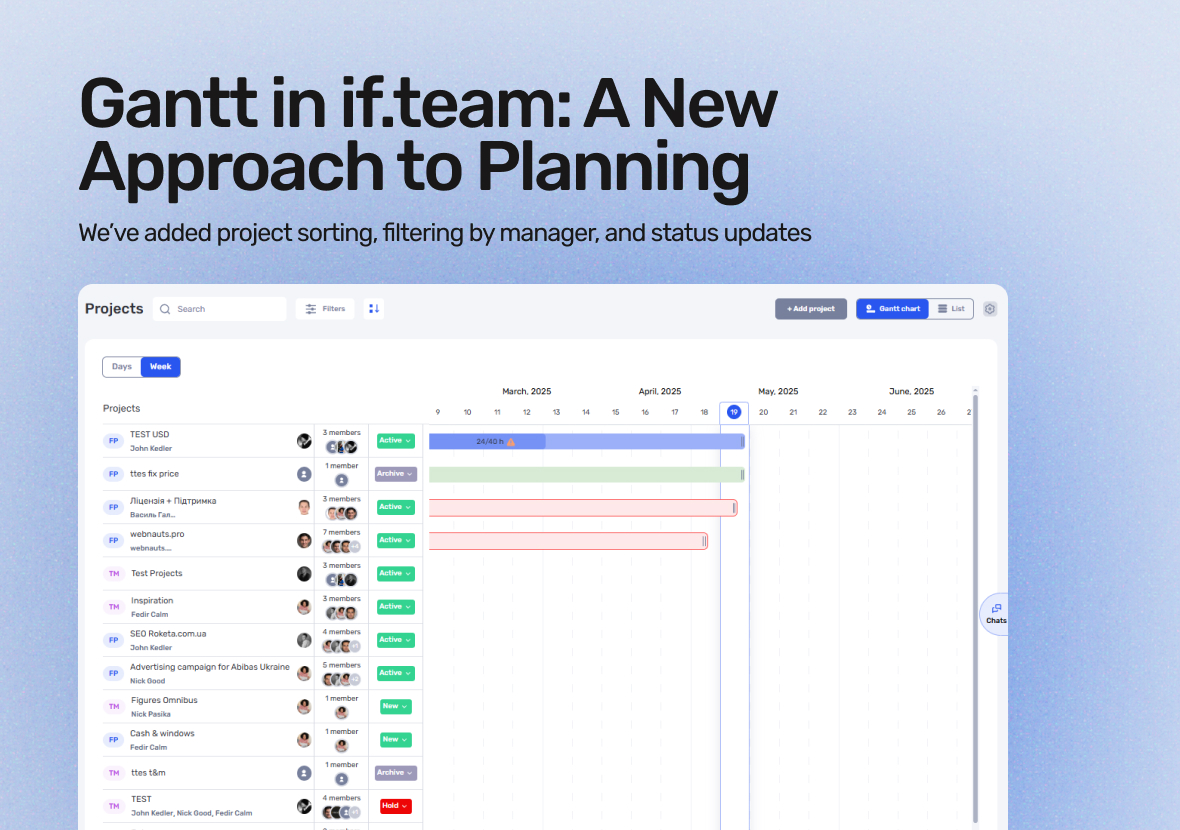
The Gantt chart is a convenient way to visually plan projects when timing matters — from start dates to deadlines. To get started, go to the Projects section and open the Gantt Chart tab. From there, everything is intuitive.
Drag and Drop projects on the calendar
To change a project’s start or end date, just drag its block directly on the Gantt chart. It’s much faster and easier than opening each project manually.
Switch between time scales
You can switch the view from daily to weekly — and back. It’s handy: zoom in for details or zoom out for the big picture.
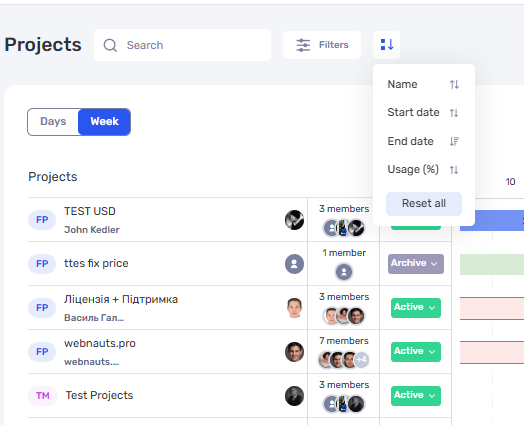
Sort projects
Sort projects by status, deadline, or other parameters — it makes navigation easier, especially when you’re managing a large number of tasks.
Filter by project managers
Need to see only your projects or a colleague’s? Turn on the manager filter. It’s handy for teams where different people handle different directions.
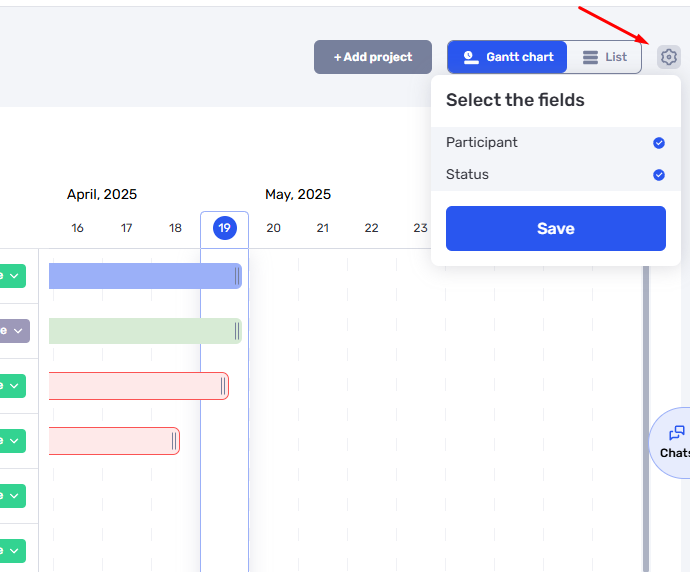
Customize what you see
In the Gantt chart, you can show or hide data types you don’t need — like extra fields. This keeps the view clean and helps you focus on what matters.
Quick status updates
You can now update project statuses right from the list — no need to open the full project card. It saves time and cuts down on extra clicks.
The Gantt chart in if.team has become more powerful. You can now drag projects to reschedule them, sort by key parameters, filter by project manager, and change statuses in just a few clicks. These updates make project management smoother and planning easier.
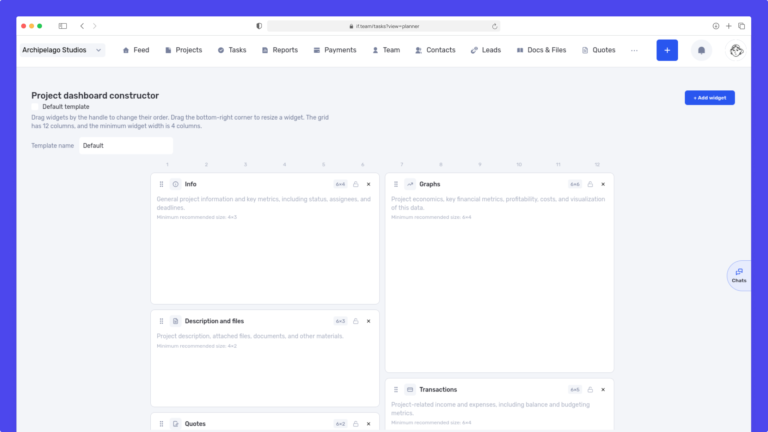
We have updated the project screen in if.team and introduced custom dashboards. Teams can now configure their workspace according to their workflows, tasks, and priorities.
Projects differ from one...
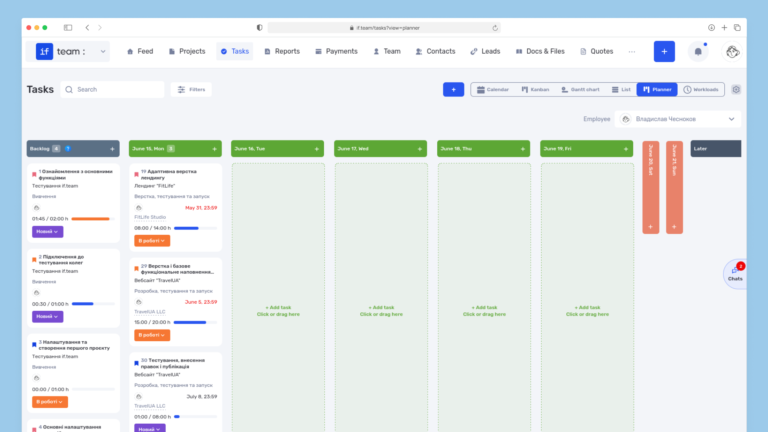
Planner is now available in if.team — a new task management mode designed to help employees organize their personal workload independently from project structures, boards, and lists.
In most teams...
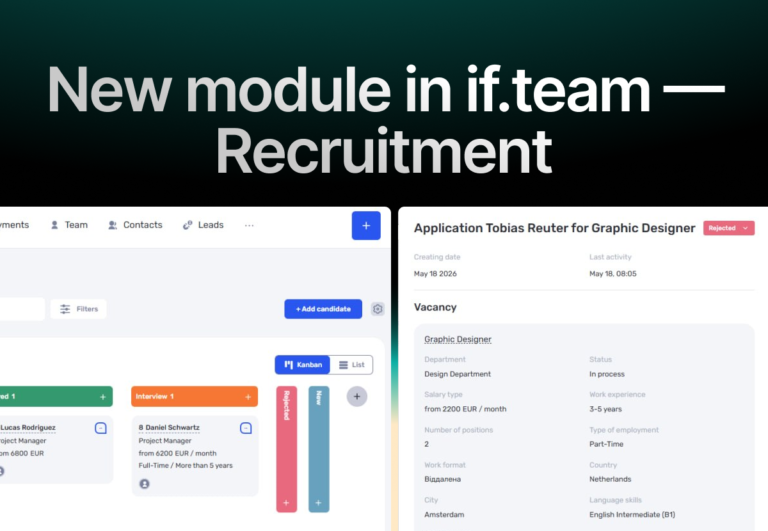
In if.team, a recruitment module has been introduced, along with an updated roles and access system. The idea here is simple — recruitment can now be managed directly inside the platform, and access...