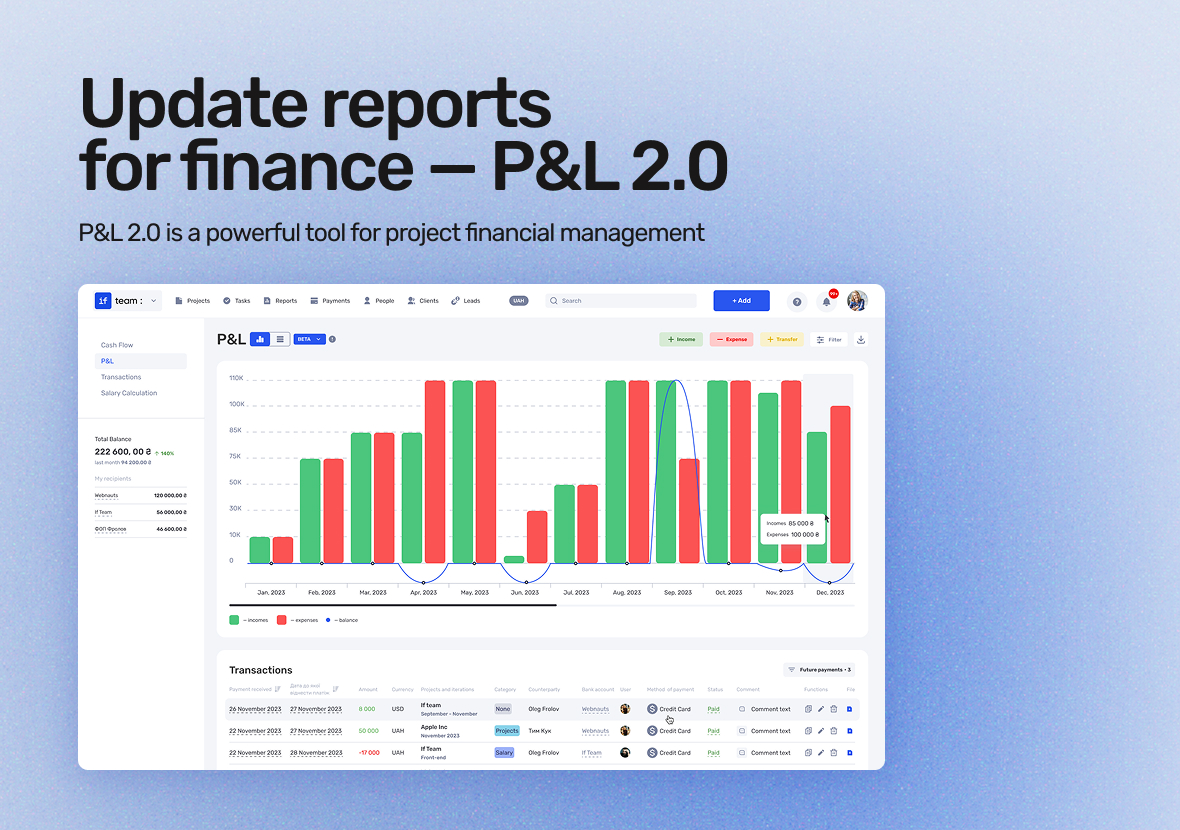
We understand how important it is for businesses to have a clear picture of their financial status. That’s why we’ve updated the Profit & Loss (P&L) report, adding features that make financial management simpler and more efficient. In this update, you’ll find not only an improved structure, but also automation that saves time. Below, we’ll take you through each of the new features in detail.
These updates are designed to provide deeper insights and streamline your workflow, allowing for faster, more accurate decision-making. With enhanced reporting capabilities, you’ll be able to monitor key financial metrics with ease and precision.
What is P&L, and how will it help your company
P&L (Profit and Loss) is a report that outlines all the income and expenses of a company over a specific period (month, quarter, year). It provides a clear picture of the financial health of the business, helping to assess its profitability and the effectiveness of cost management. With this report, you can understand where the company is earning and where it is spending, allowing you to adjust strategies and improve financial performance in real time.
How P&L benefits your company:
Transparency of financial flows: P&L provides a breakdown of all income and expenses by category (revenue, cost of goods sold, operating expenses, etc.). This helps you clearly understand where profits are coming from and where the expenses are going, as well as identify areas that need attention.
Quick decision-making: With up-to-date data from P&L, managers can quickly make key decisions regarding investments, cost optimization, and strategy adjustments. You get all the necessary data to make decisions that impact the company’s future growth.
Profitability analysis: P&L allows you to assess the profitability of different products or business areas, helping you allocate resources wisely. You can identify which products or services bring the most profit and which may need strategy changes or even discontinuation.
Preparation for investment: A transparent and accurate profit and loss report builds trust with potential investors or partners. If you are planning to attract investment or enter into partnerships, a well-structured P&L will showcase your financial stability and growth potential.
With the updated P&L 2.0, you gain a powerful financial management tool that not only gives you an accurate snapshot of your business at the moment but also allows you to respond to changes, optimize costs, and make more informed financial decisions.
Convenient navigation by years and quarters
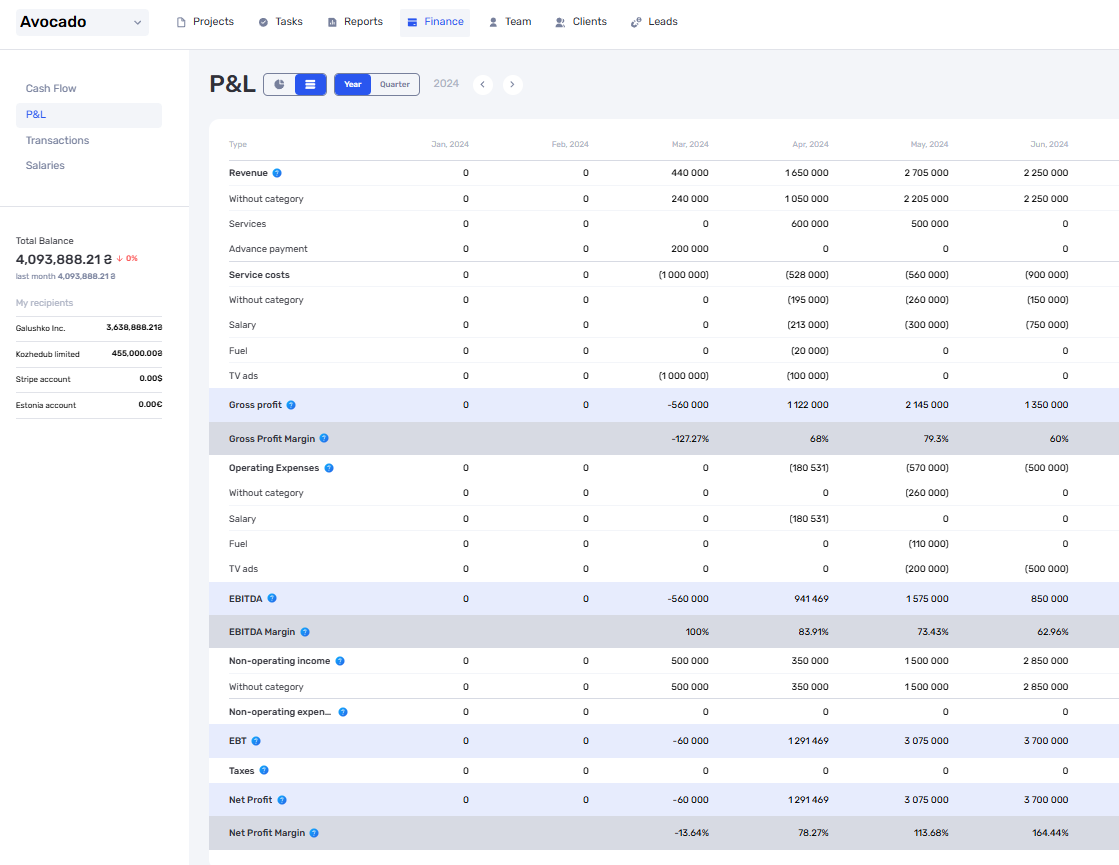
One of the main advantages of the updated P&L is the convenient navigation across different periods. Now, you can easily switch between years and quarters to quickly access the information you need for any given time frame. All data loads instantly, even when selecting larger periods.
This feature significantly simplifies working with large volumes of data, allowing for easy comparison of financial metrics across different periods. Managers and analysts can quickly assess changes in income and expenses, track trends, and adjust the company’s strategy in time. With this feature, you can evaluate the effectiveness of different periods of activity, enabling more informed decision-making.
Correct P&L structure
The new structure of P&L 2.0 is built according to international standards and is designed to provide the most accurate representation of the company’s financial situation. The report now includes all key categories necessary for a comprehensive analysis of financial health: revenue, cost of goods sold, operating and non-operating income and expenses, EBITDA, margin, and more.
Each of these elements provides a clear view of the business’s status. You will be able to clearly see which expenses are essential for supporting core activities and which arise from supplementary activities. This level of detail helps to quickly identify issues and optimize expenses in specific categories. The report also allows you to understand how profitability is changing, which cost items require attention, and how to effectively manage profits.
Date and P&L category in transactions
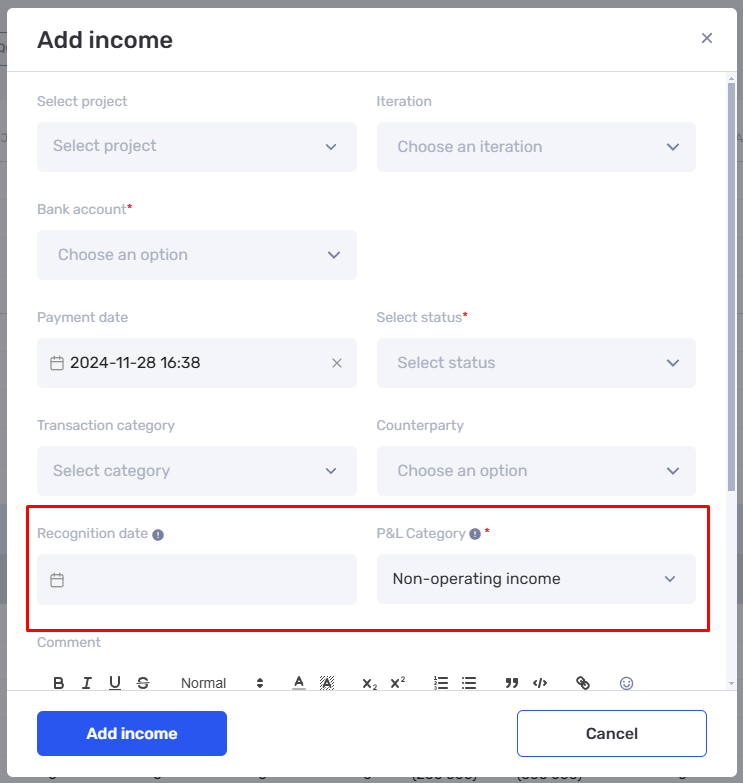
The updated P&L 2.0 automatically adds two important parameters to each transaction: the date of allocation to the period and the P&L category. With this feature, you no longer have to worry about the accuracy and correctness of entering these details manually. The system automatically determines the period to which the transaction belongs and categorizes it into the appropriate sections of the report.
This functionality significantly simplifies the reporting process, as you no longer need to manually review each transaction. All data is automatically displayed in the correct categories, reducing the risk of errors and saving time. You can be confident in the accuracy of the results and focus on financial analysis rather than data collection and sorting.
Export to Excel
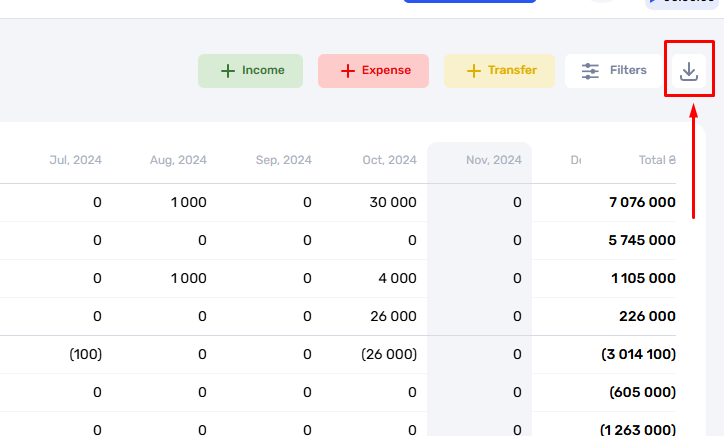
P&L 2.0 allows you to export all data to Excel, unlocking new opportunities for analysis. You’ll be able to create custom reports, tailoring the data to your company’s specific needs. This is especially convenient for financial analysts and accountants who frequently work with spreadsheets and require flexibility in managing data.
Excel export lets you work with financial metrics offline and easily share reports with colleagues or partners. You can quickly create your own analytical tables or charts for a deeper understanding of your financial situation. This feature not only helps you generate ready-made reports but also adapt them to your specific tasks.
Automatic transaction categorization
One of the greatest advantages of the updated P&L 2.0 is the automation of transaction categorization. The system now automatically determines which section of the report each transaction belongs to, reducing the need for manual actions. This helps save time when generating reports and reduces the likelihood of errors.
All income and expenses are automatically categorized, minimizing the need to manually assign each transaction to a specific P&L item. As a result, you can spend more time analyzing data rather than entering and verifying it. This function also helps maintain financial accuracy and security.
The updated P&L 2.0 is a powerful financial management tool that greatly simplifies the report creation and financial data analysis process. With its new features, you can work faster and more efficiently with financial data, allowing your company to make more informed decisions and maintain financial stability at any stage of development.
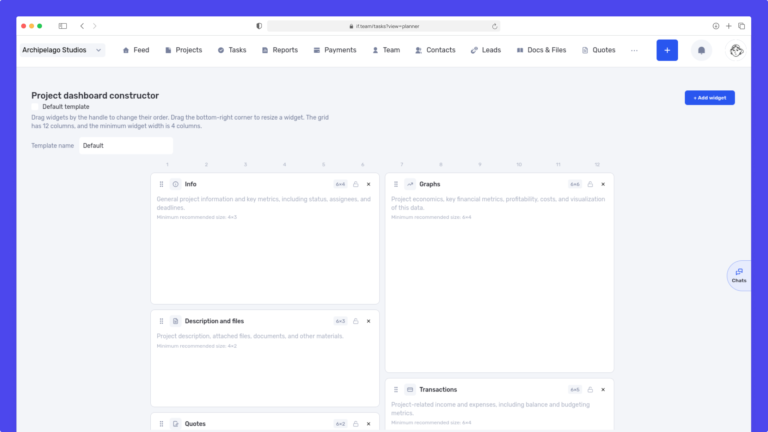
We have updated the project screen in if.team and introduced custom dashboards. Teams can now configure their workspace according to their workflows, tasks, and priorities.
Projects differ from one...
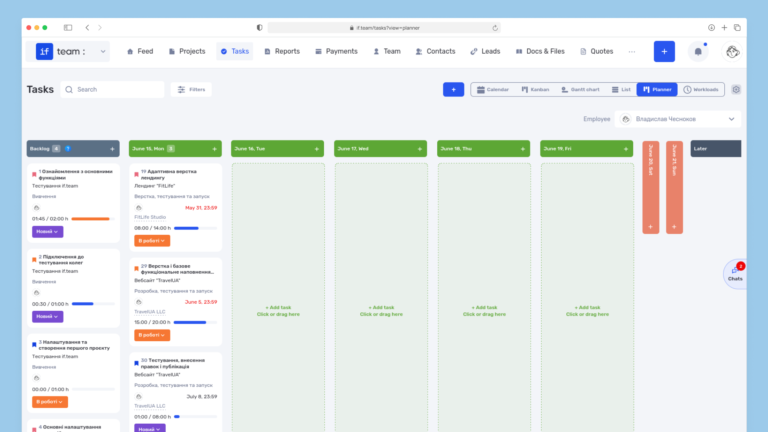
Planner is now available in if.team — a new task management mode designed to help employees organize their personal workload independently from project structures, boards, and lists.
In most teams...
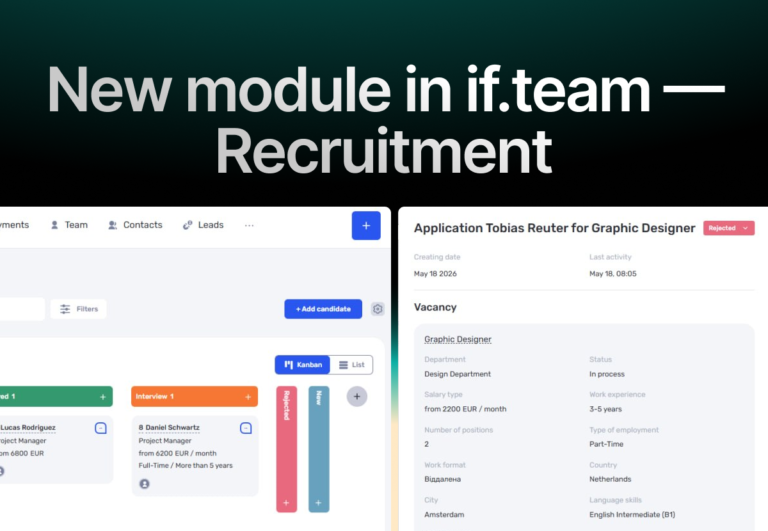
In if.team, a recruitment module has been introduced, along with an updated roles and access system. The idea here is simple — recruitment can now be managed directly inside the platform, and access...